
What Does Cheaper Inference Actually Mean?

One topic I found myself quite interested in was the claim that inference costs fall by X orders of magnitude every year. The numbers always sounded surprising, at least given how I thought I would measure them. Hence this piece: an attempt to decompose this cost reduction into three layers, estimate how much each contributes, and try to find a “realistic” estimate of the annual rate.
Three Layers
In a rudimentary split, cost efficiencies can come from three different layers:
Hardware
Algorithms
Model capability
New hardware generations can increase token throughput by more than their price increases, making newer hardware a cheaper alternative for serving the model. Algorithmic improvements range from broadly useful techniques, such as memory management, scheduling, and workload partitioning, to optimizations tailored to a specific workload. They make model serving on existing hardware more efficient, provided the hardware supports the required advanced features.
Model capability is the third layer. Smaller models can take on work once reserved for larger models, either by becoming capable of solving more complex tasks or by matching a larger model on defined benchmarks. The difficult part is measuring that substitution honestly.
Data
The biggest issue with this kind of analysis is data availability. There is relatively little open-source data that allows us to isolate hardware, models, and algorithms into useful control groups. In practice, individual algorithmic improvements are rarely measured in isolation, and benchmarks often include changes across the entire serving stack, including the inference engine, kernels, and images. It is also difficult to find the same model and engine tested across multiple hardware generations. However, we will work with what is available and aim for a useful approximation rather than a perfect decomposition. The benchmark data we will use comes from:
MLPerf Inference, a standardized suite of vendor-submitted system benchmarks maintained by MLCommons.
InferenceX, an open collection of LLM serving benchmarks across different accelerators and inference engines.
For GPU prices, we will use public on-demand prices from AWS, CoreWeave, Google Cloud, Lambda, Microsoft Azure, Nebius, Oracle Cloud. The Silicon Data index provides a separate market reference, but we will not treat one index value as the only plausible rental price.
Hardware
This is probably the most straightforward layer. New hardware lowers cost when its efficiency gain outweighs its higher price. We can measure this as the cost of generating one million output tokens: combine benchmark throughput in output tokens per second with the GPU’s hourly price.
USD per million output tokens = GPU-hour price × 1,000,000 / (output tokens/s/GPU × 3,600)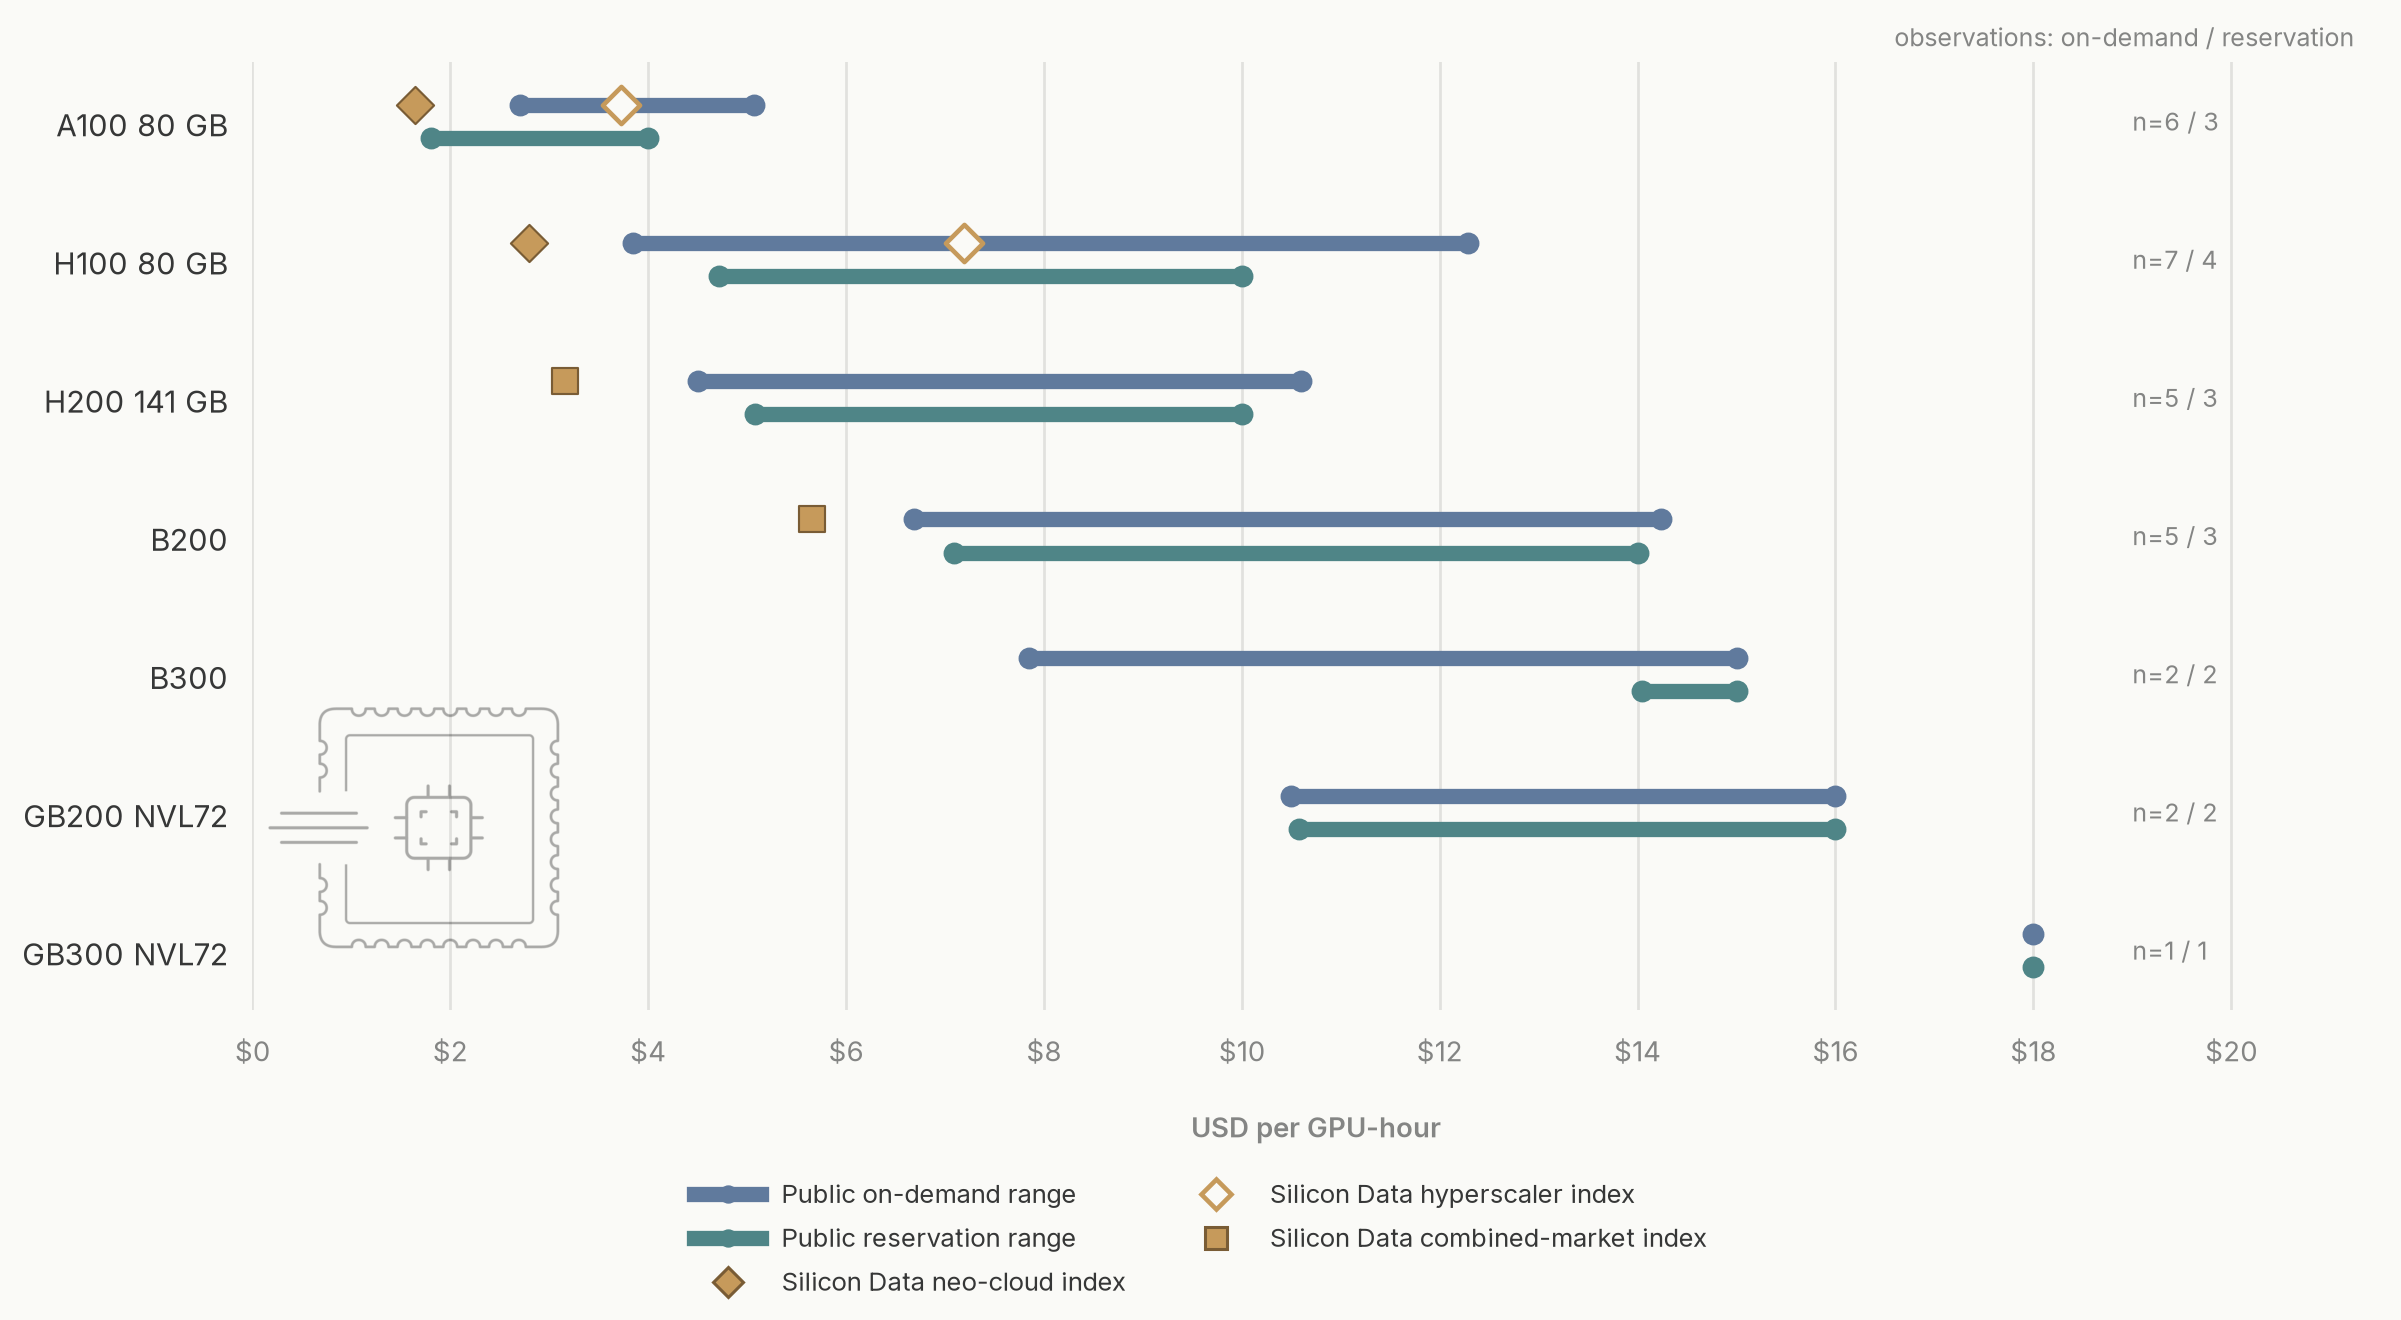
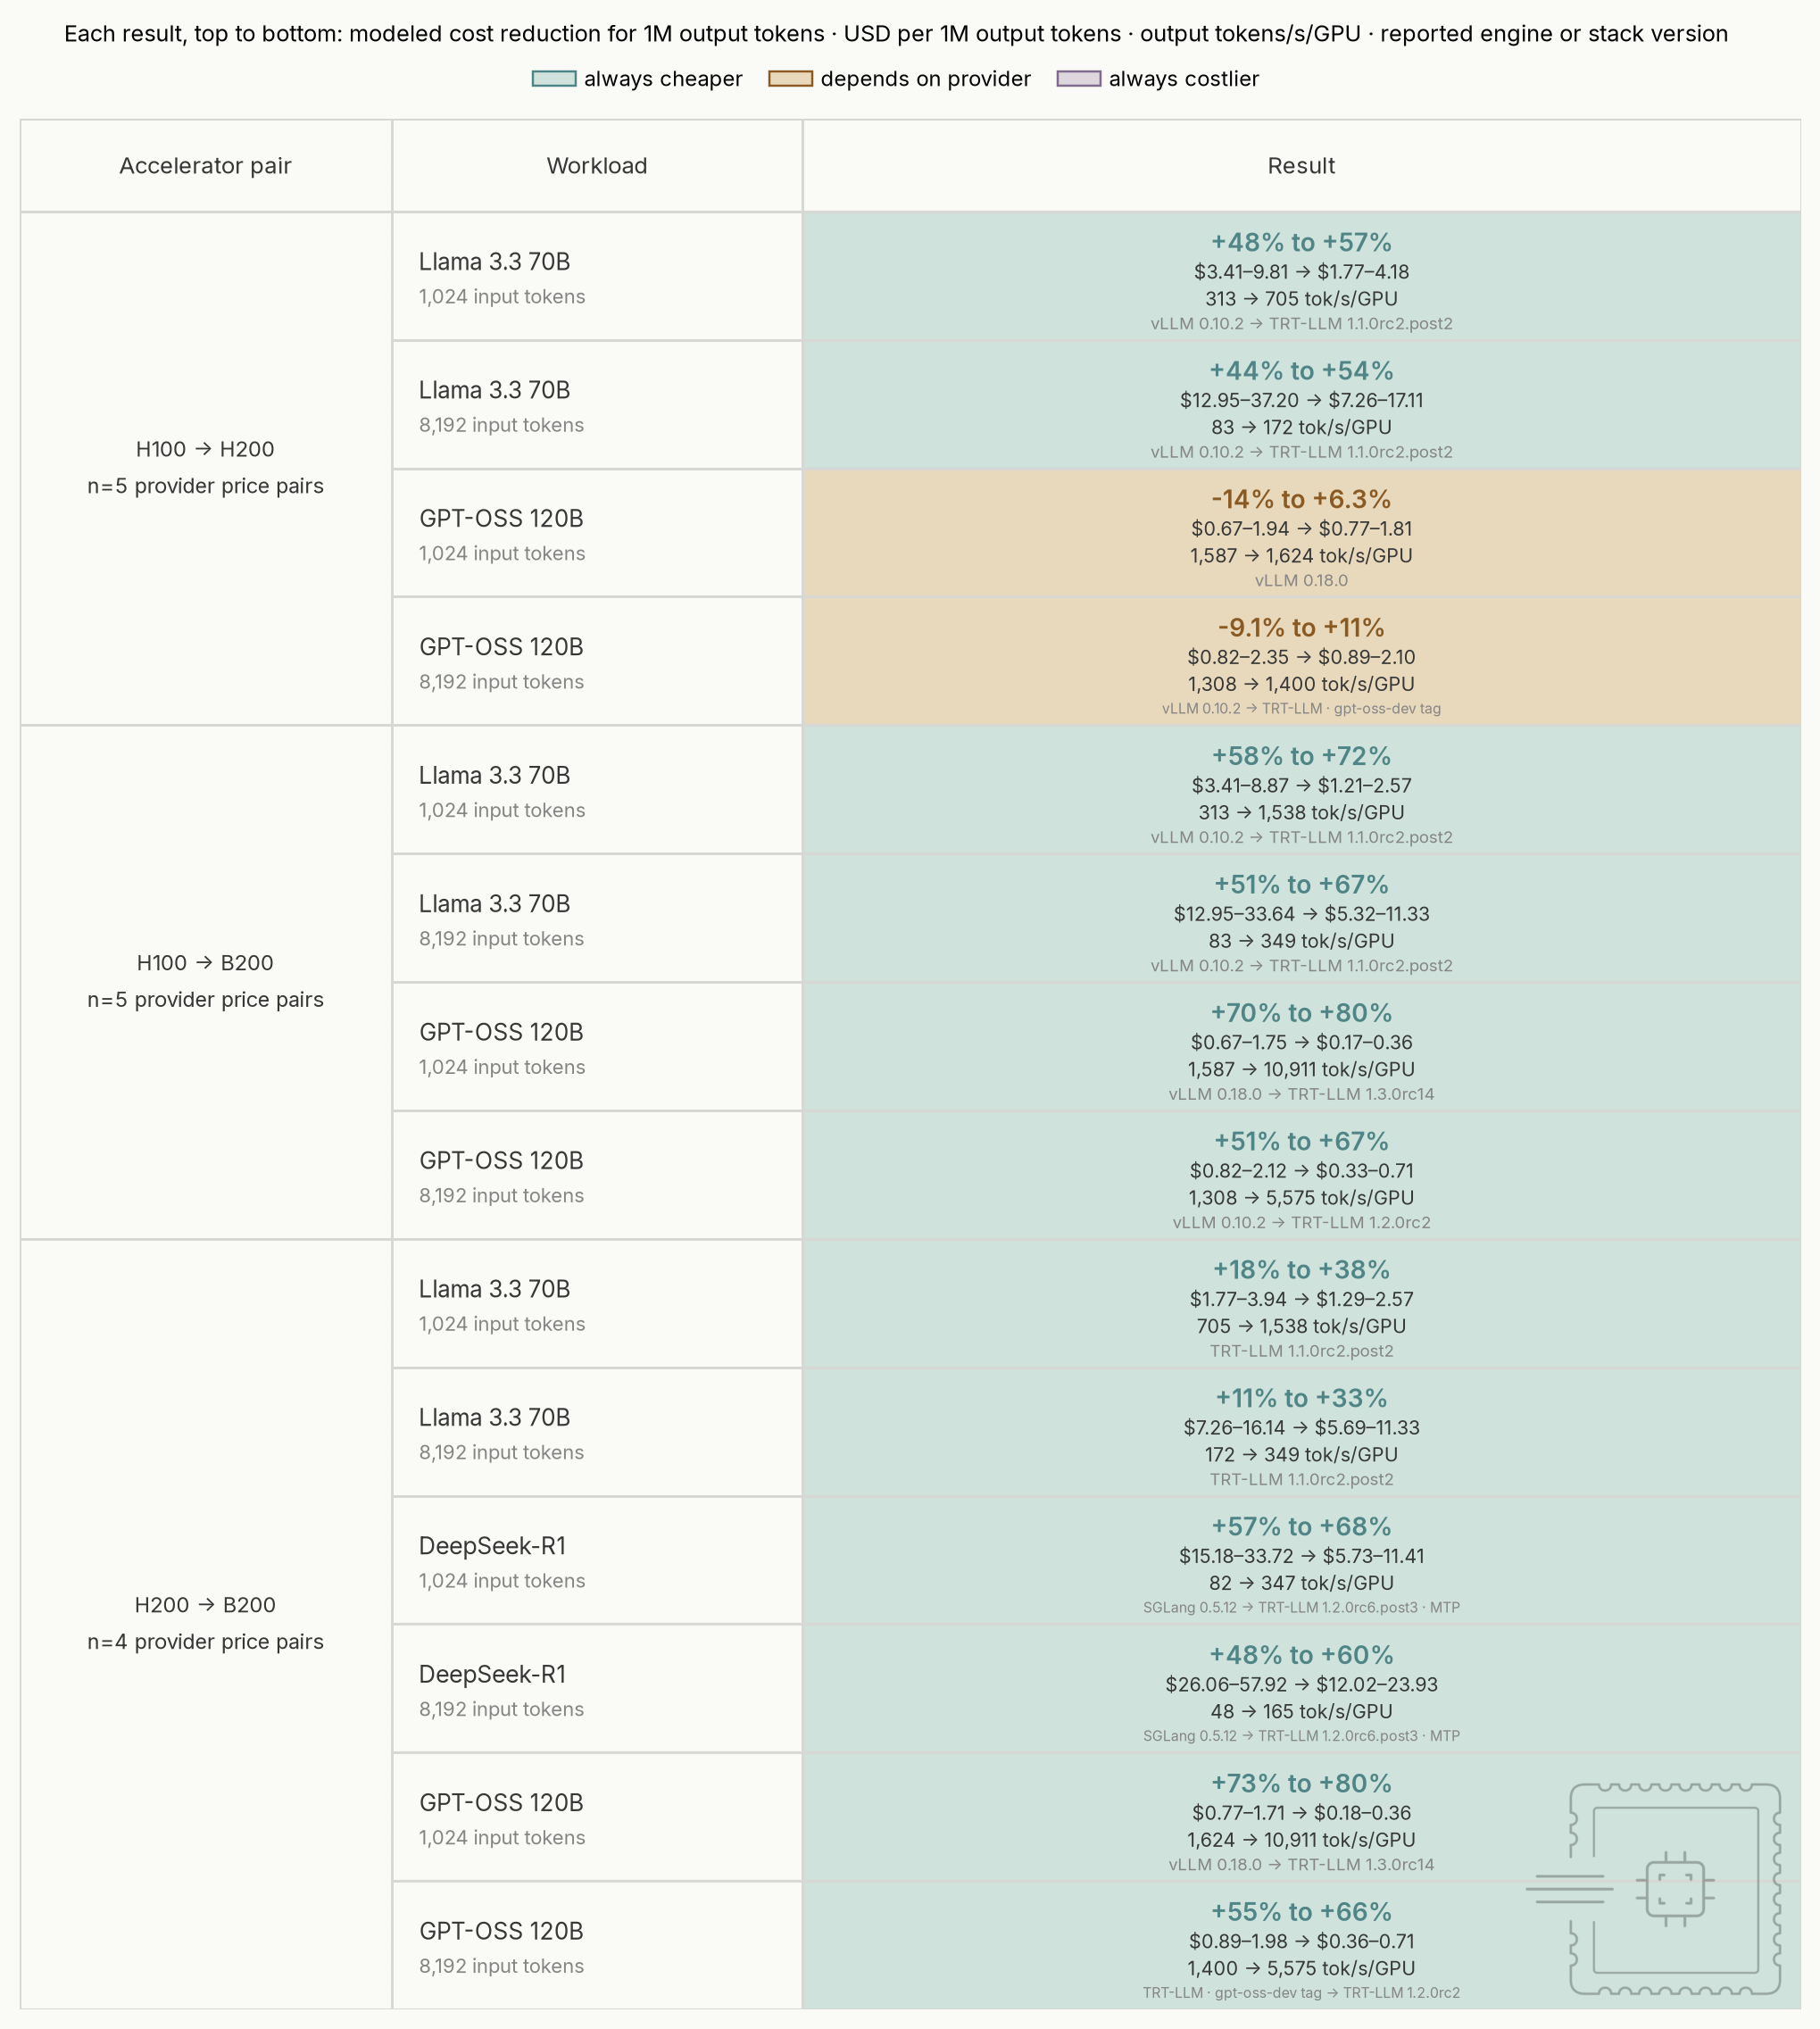
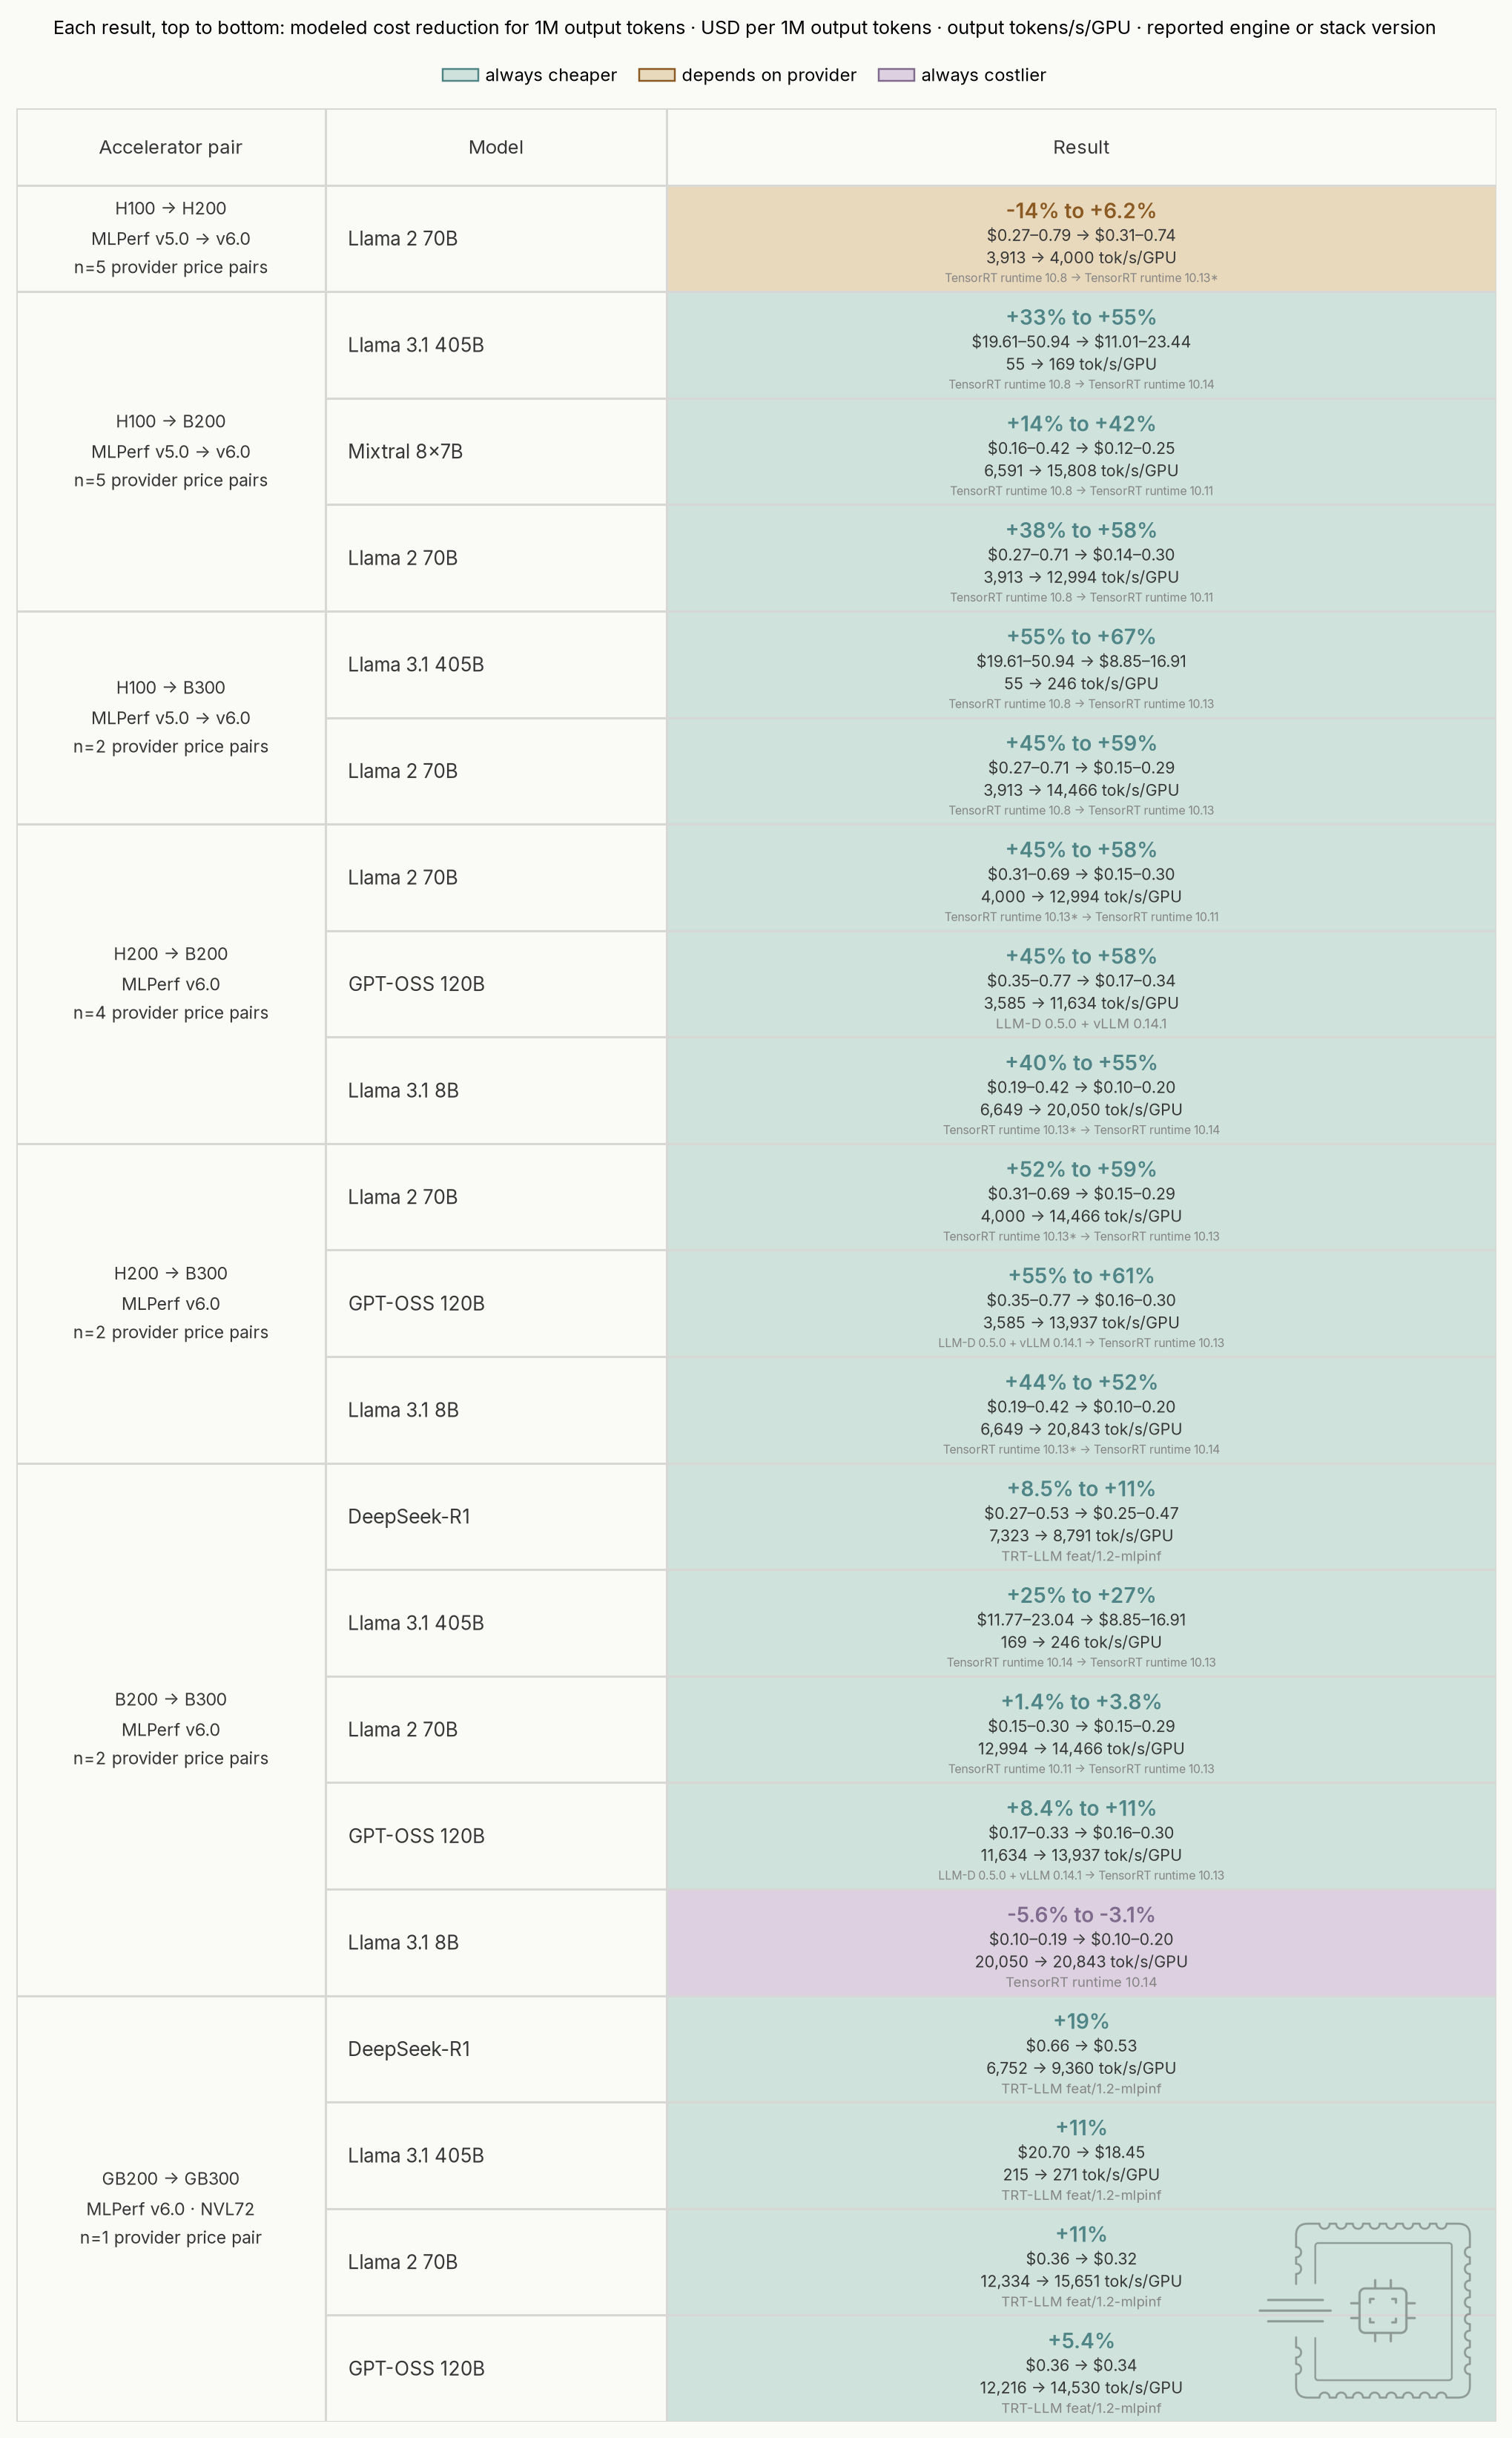
To estimate the H100-to-B300 period, I take the MLPerf comparison. Both matched workloads use TensorRT-LLM, with TensorRT runtime 10.8 for the H100 and 10.13 for the B300. The corresponding TensorRT-LLM builds are roughly 343 days apart. The comparison shows a 56.5% reduction over the three-years, but to estimate the hardware component in isolation, we need to remove the possible algorithmic contribution.
Algorithms
Model inference has seen many algorithmic improvements. The field was still young, with plenty of ideas to borrow from operating systems and high-performance computing, especially in memory and cache management, scheduling, and workload interleaving:
Continuous batching. Orca, Yu et al., OSDI 2022 rebuilt the active batch after every generation step, replacing completed requests without waiting for the rest of the batch.
FlashAttention. Dao et al., NeurIPS 2022 tiled exact attention through on-chip memory to avoid repeatedly moving large intermediate results through GPU high-bandwidth memory.
Speculative decoding. Leviathan et al., ICML 2023 used a cheaper model to propose several tokens that the target model could verify in parallel without changing its output distribution.
SmoothQuant. Xiao et al., ICML 2023 moved quantization difficulty from activation outliers into the weights, making efficient W8A8 execution practical.
PagedAttention. vLLM, Kwon et al., SOSP 2023 stored the KV cache in non-contiguous fixed-size blocks, reducing memory fragmentation and making blocks easier to allocate, share, and recycle.
RadixAttention. SGLang, Zheng et al., ASPLOS 2024 organized shared request prefixes in a radix tree so their already-computed KV-cache blocks could be reused.
AWQ. Lin et al., MLSys 2024 used activation-aware weight quantization to reduce model memory and bandwidth while protecting the most important weights.
Chunked prefill. Sarathi-Serve, Agrawal et al., OSDI 2024 split long prompt processing into bounded chunks that could be interleaved with token generation.
Prefill/decode disaggregation. DistServe, Zhong et al., OSDI 2024 placed prompt processing and token generation on separate worker pools that could be provisioned independently.
Constrained decoding. XGrammar, Dong et al., MLSys 2025 precomputed most grammar checks and overlapped the remaining CPU work with GPU execution.
Intra-device execution overlap. NanoFlow, Zhu et al., OSDI 2025 split batches into smaller units and overlapped compute-bound, memory-bound, and network-bound operations within each GPU.
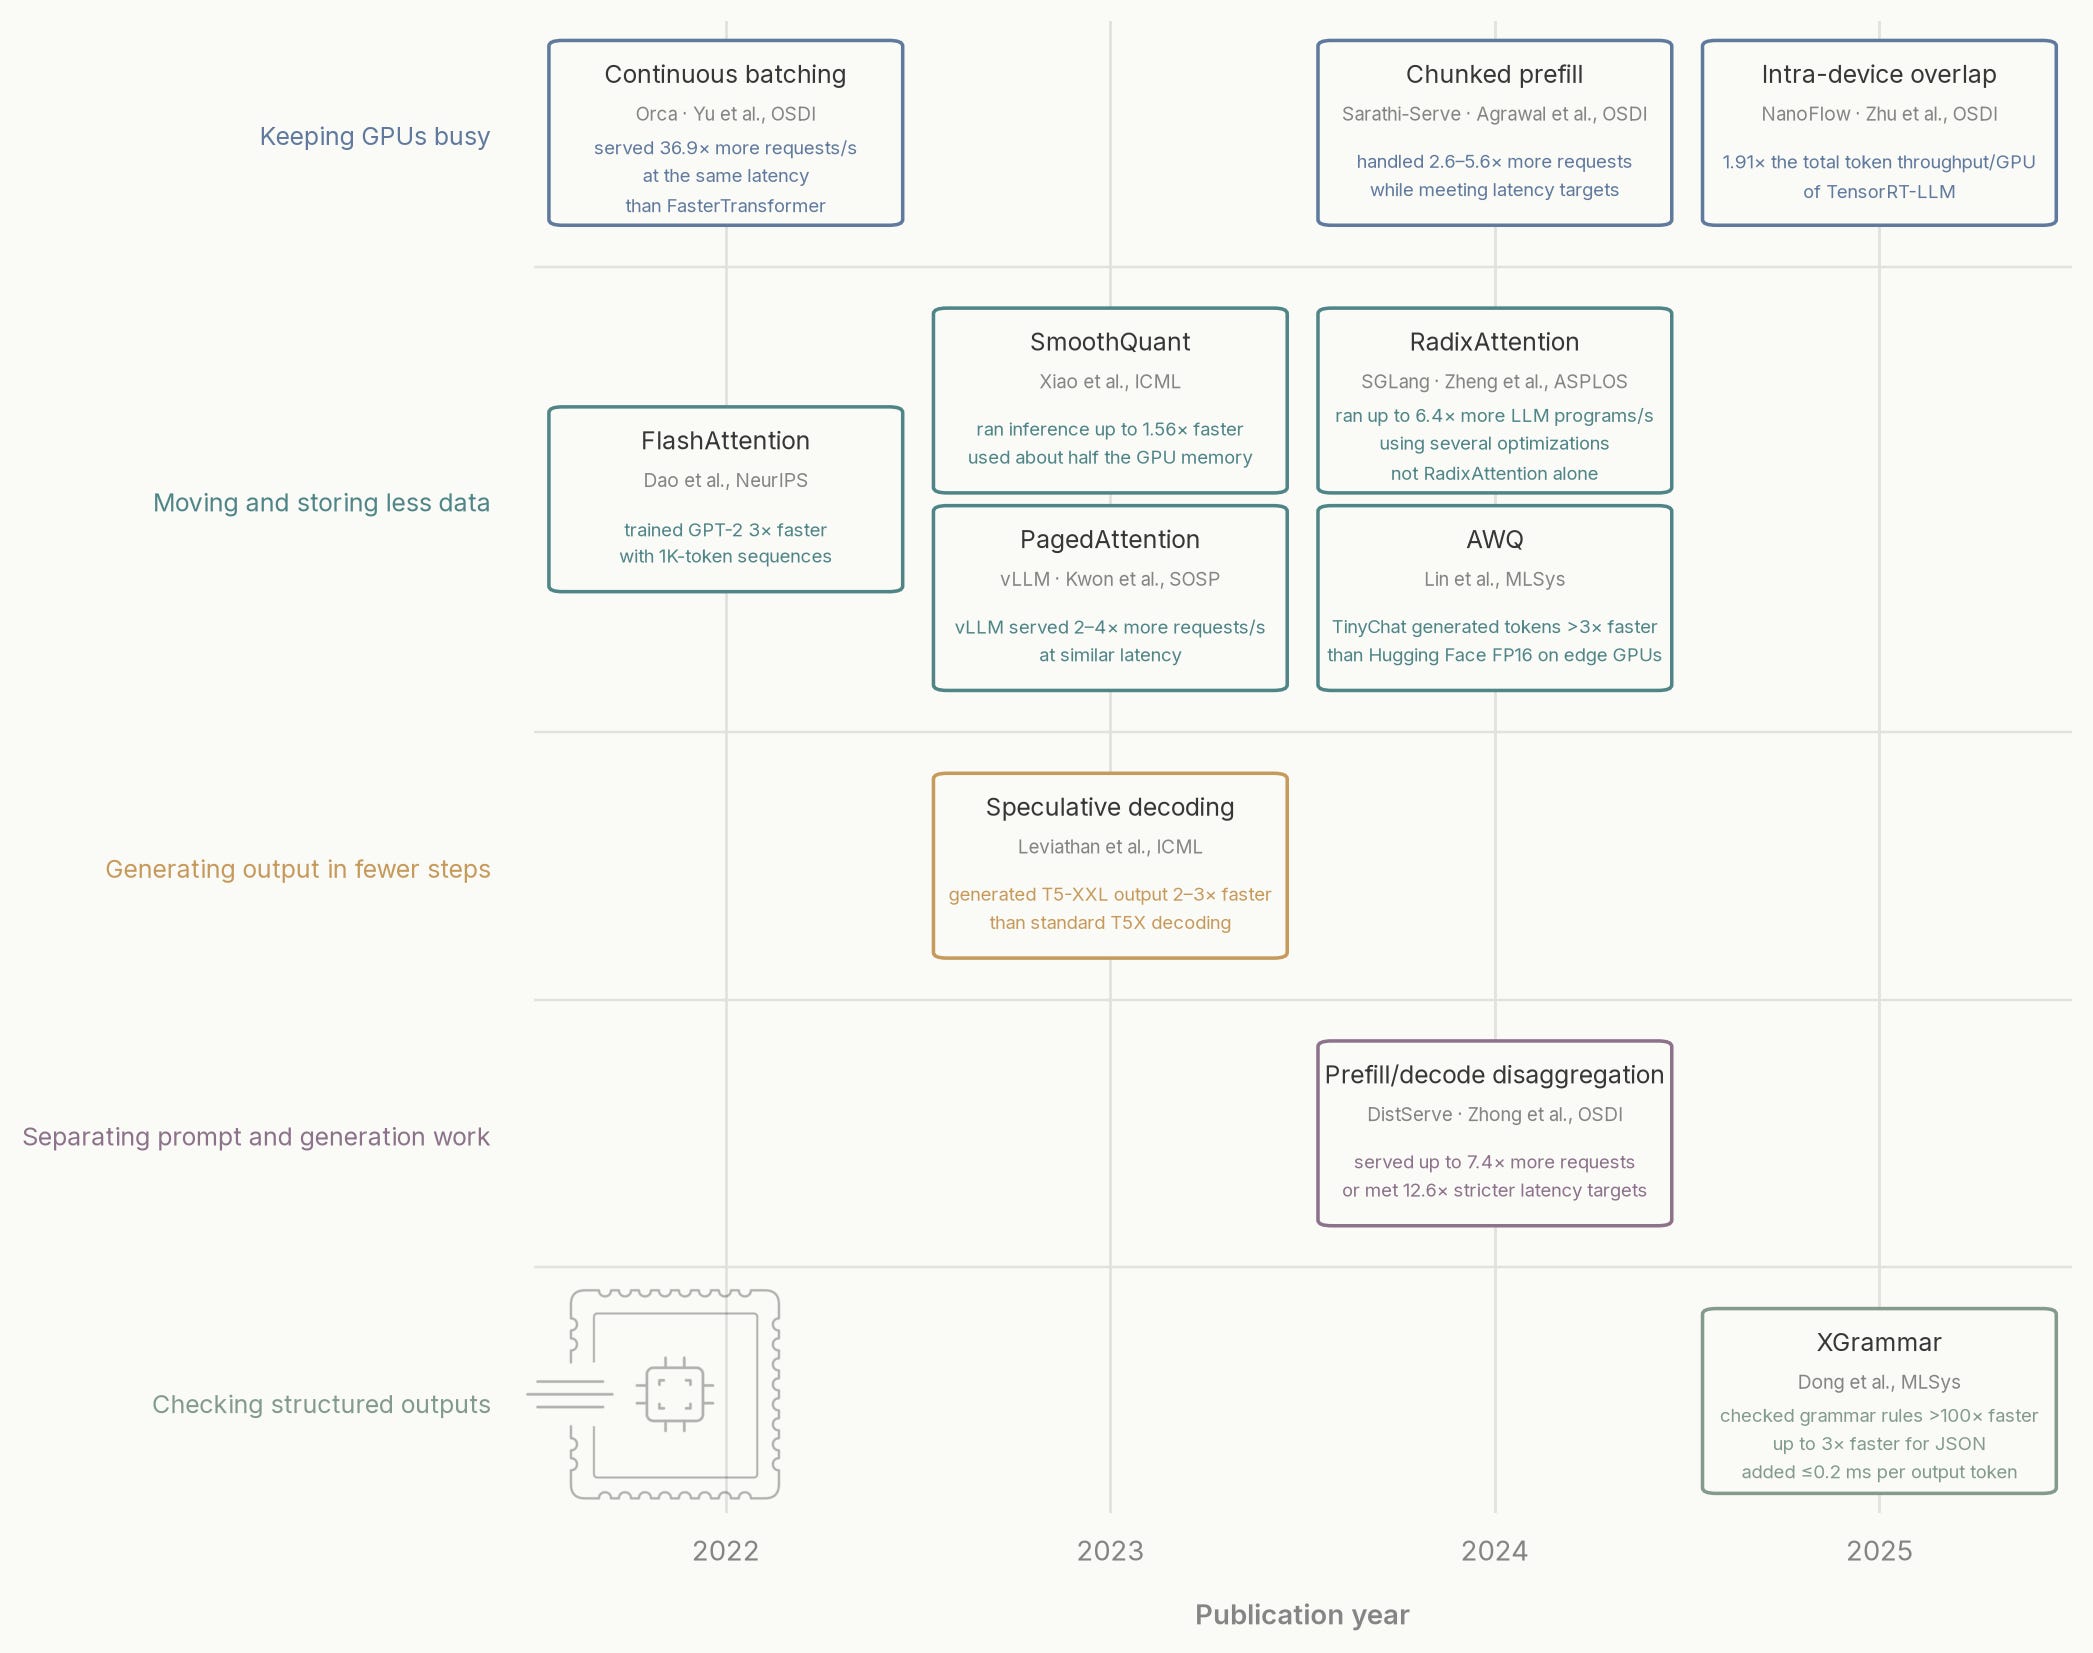
For cases like continuous batching, the paper produced a dramatic headline result, but its baseline was a simple request-level batching. Improvements that remove such naive solutions can only happen once, so later scheduling advances should not be expected to reproduce a 36.9× gain.
More generally, these are results reported by the papers’ authors under different models, hardware, workloads, and baselines. To estimate their realistic impact in general-purpose serving engines, we need to look at benchmark data, even if the available dataset is small and imperfect.
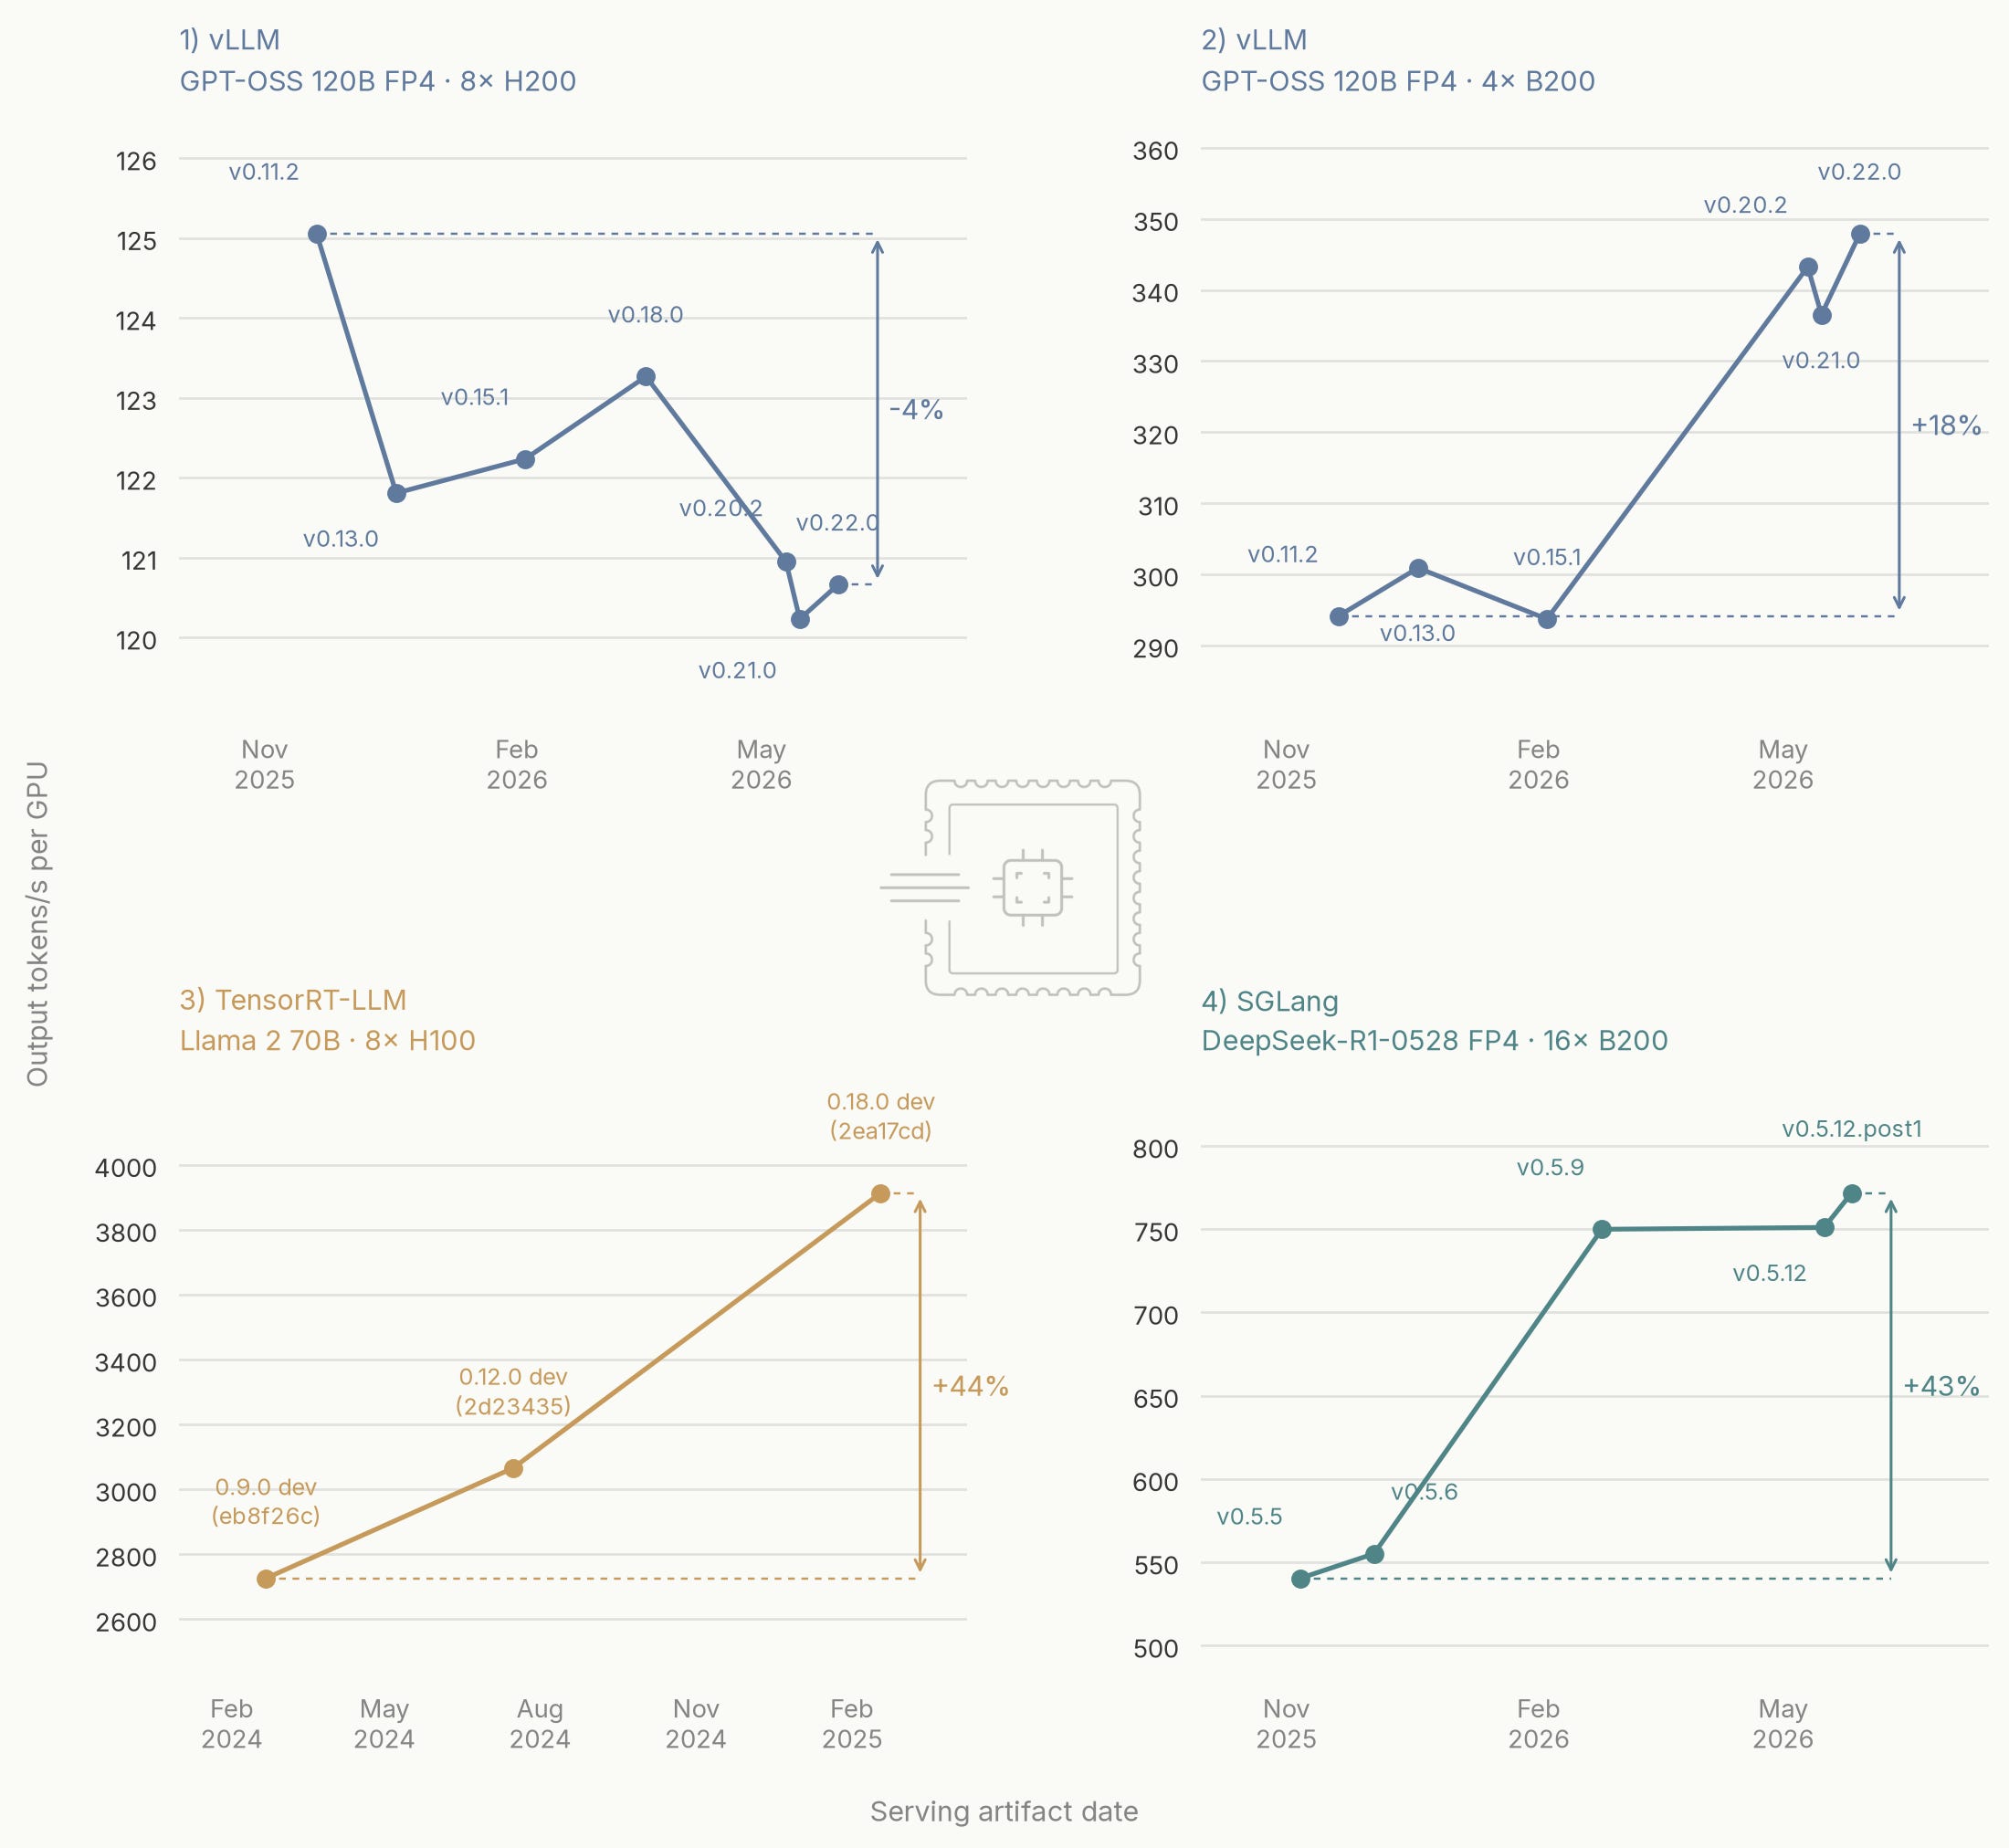
Trying to draw conclusions here is hard as well, as the histories are short, sparse, and rarely cover a fixed model and hardware configuration for long. Within each one, hardware, model, and workload stay fixed, but every release can change the complete software container. Hence, we are measuring the full-stack improvement, not isolated engine gains.
For our selected four cases, when annualized, the results diverge a bit. vLLM serving GPT-OSS 120B FP4 raises modeled cost by 7.1% on H200, but cuts it by 27.6% on B200. TensorRT-LLM serving Llama 2 70B on H100 shows a 30.5% reduction, while SGLang serving DeepSeek-R1-0528 FP4 on B200 shows 47.6%.
To build a forward-looking estimate, I will make two heuristics. First, I exclude the vLLM H200 result, as the same vLLM releases improves performance on B200 while regressing on H200. This shows that software gains do not transfer evenly across all hardware, and that these newer vLLM tunings were not optimized for H200 profile.
Second, I average the vLLM B200 and TensorRT-LLM H100 results only, as they are more mature serving stacks (would expect SGLang to have sharper rises until it reaches similar maturity and performance as other two). Their 27.6% and 30.5% reductions imply an optimistic average of roughly 29% per year. Let’s also assume that this number will be valid only for newer accelerators, as older ones are unlikely to continue being considered for optimizations and tuning.
Model Capability
Model capability is the least rigorous layer in this piece (when we were already quite hand-wavy above). The way it is usually measured in industry is by fixing a score threshold on one benchmark, or a small set of them, and then treating every model that clears it as comparable. When a significantly smaller model matches a larger one in such a comparison, the perceived inference cost for the task drops dramatically.
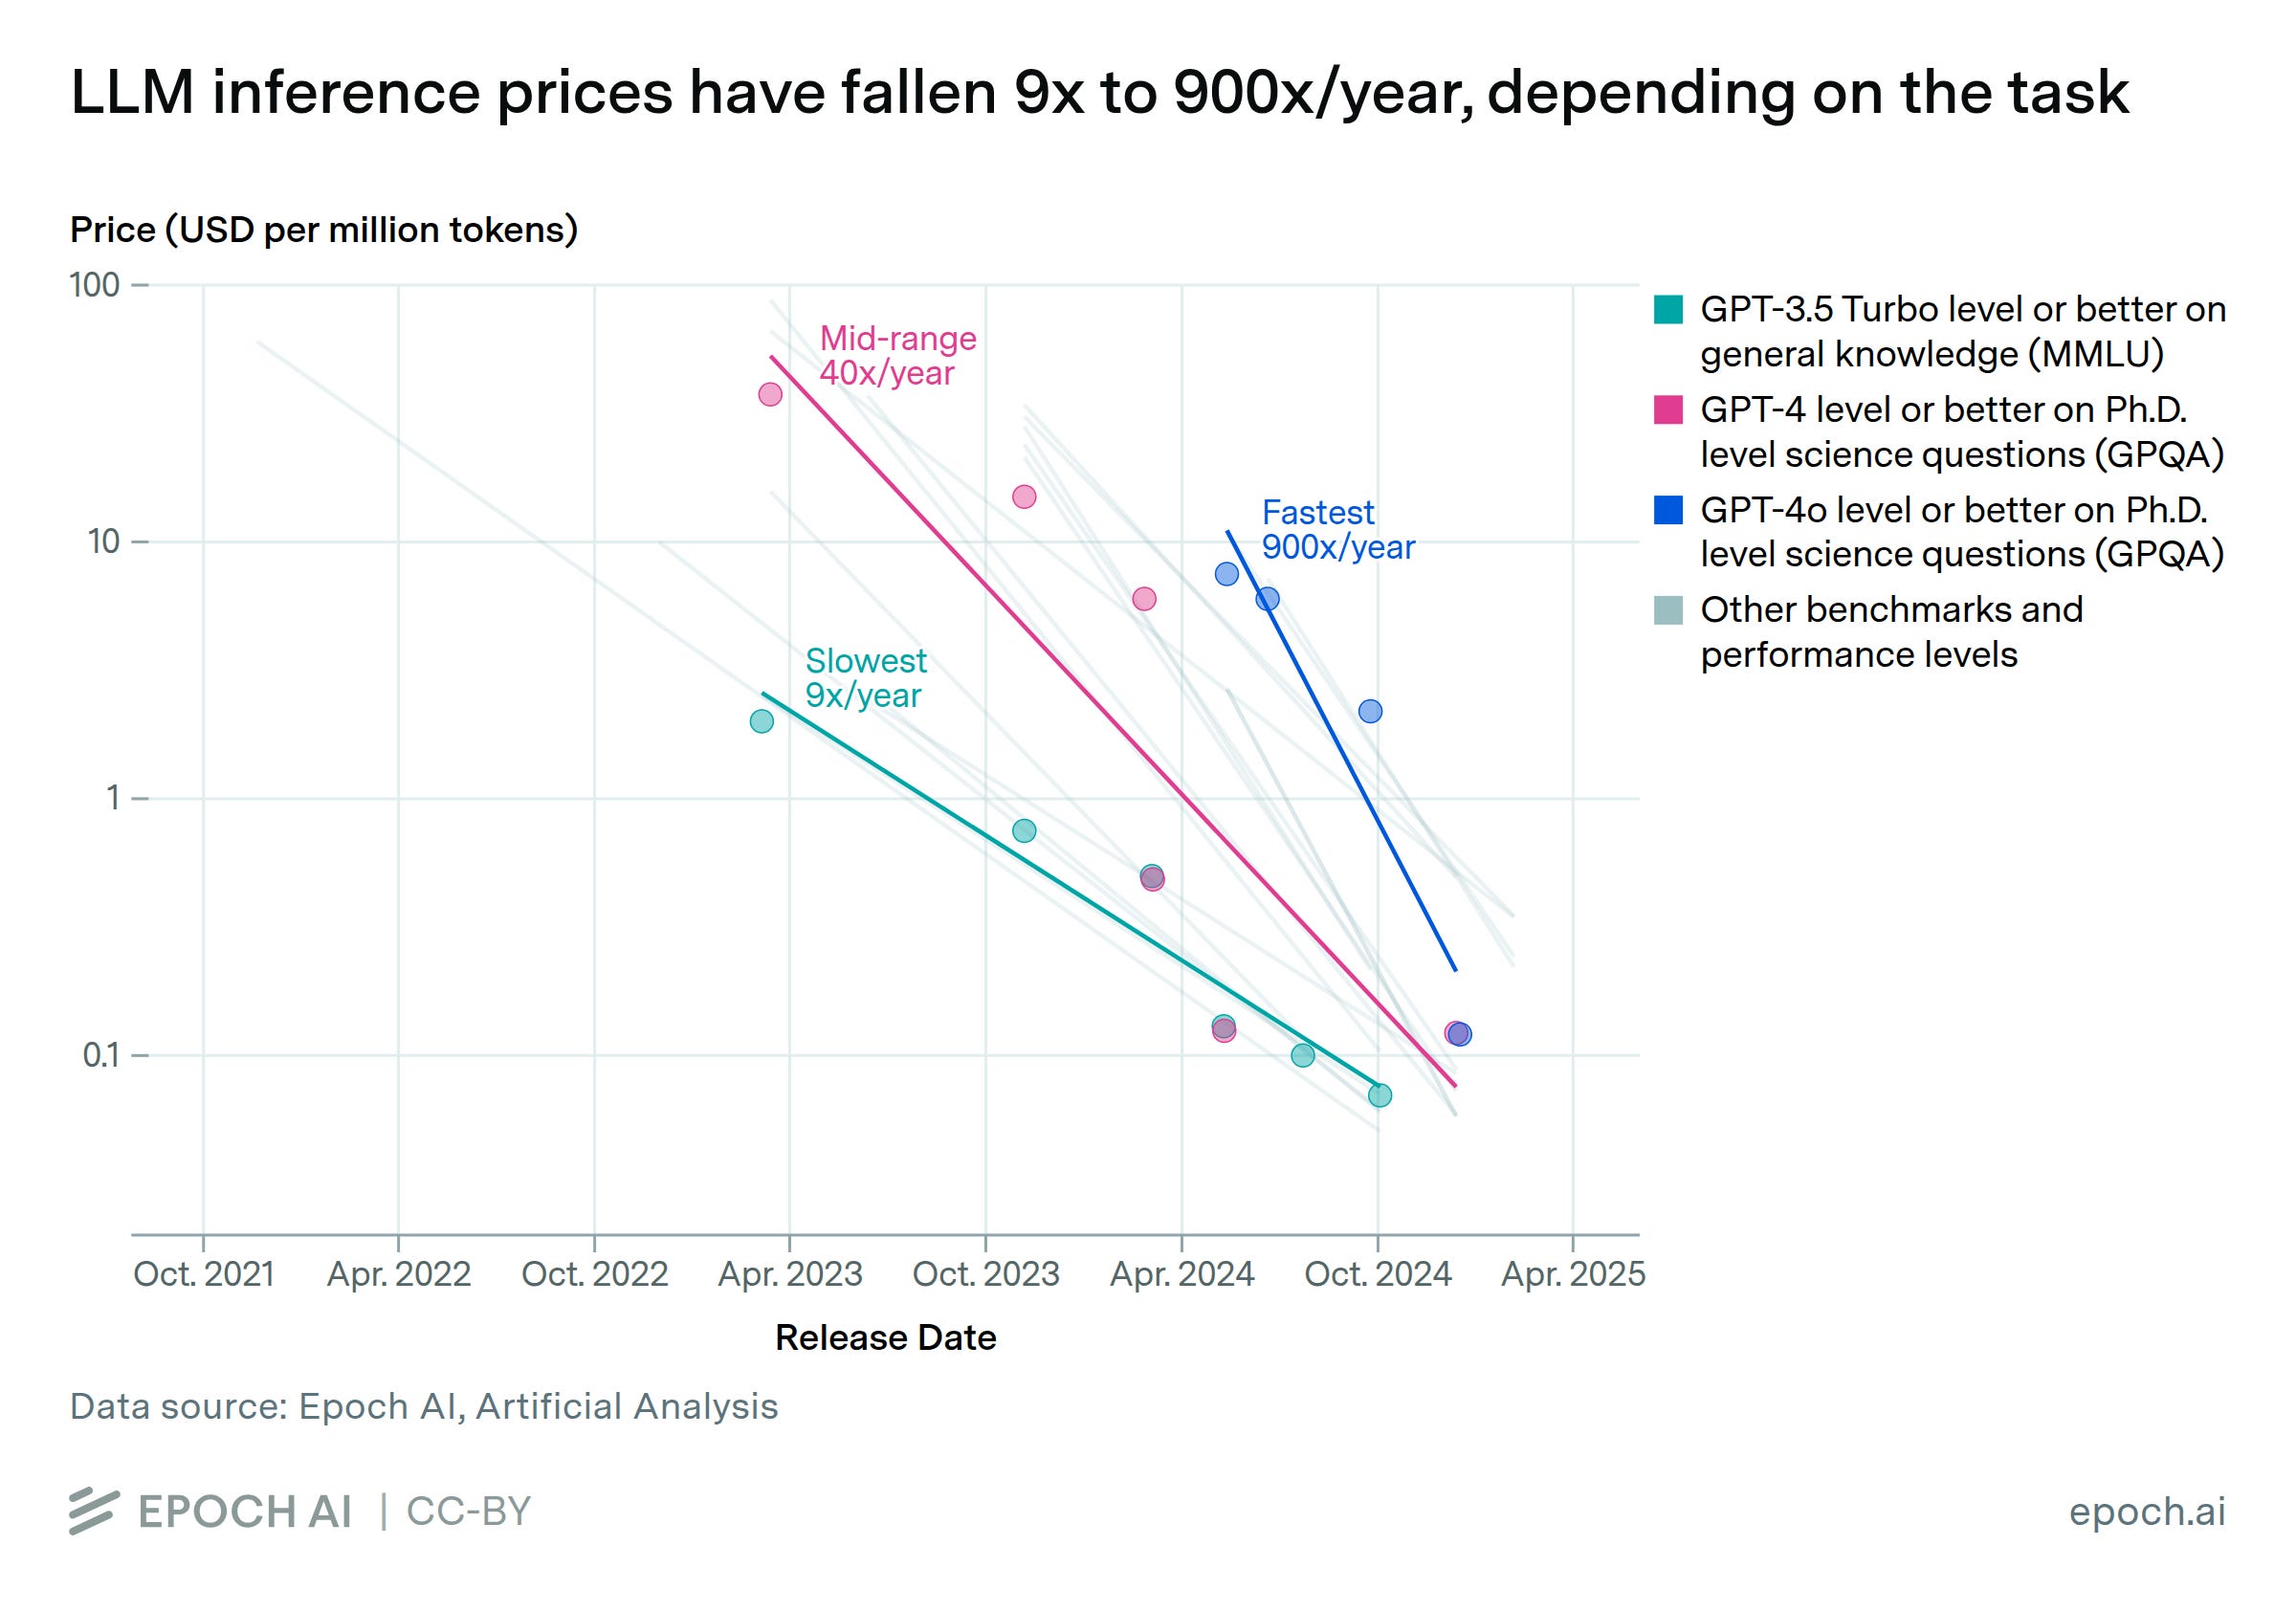
The first limitation of such an approach is benchmark validity. A score may have weak construct validity, meaning it fails to measure the capability we care about, or weak external validity, meaning it fails to transfer to the deployment distribution. The second problem is that models have a jagged capability profile: performance can vary substantially across tasks that appear similarly difficult but belong to different domains. Domain specialization may improve performance on the target distribution while causing regressions in other domains or broader capabilities. This is already becoming more obvious to a wider audience, given how strongly coding-focused models such as GPT-5.6 and Fable/Opus 5.0 have regressed on clear, compact writing tasks and similar.
Capability-driven cost reduction can be real when a smaller model meets the quality bar on a held-out, uncontaminated internal evaluation and is deployed only for that domain. The cost per task can then fall, but this does not represent a general decline in inference cost.
Combined Estimate & Takeaways
Let’s combine the results from the hardware and algorithmic sections. The hardware benchmarks showed a 56.5% reduction over three years, while the TensorRT-LLM stacks used in those results were 343 days apart. The TensorRT-LLM estimate suggests an annual serving-stack cost reduction of 30.5%, or roughly 29% over 343 days.
Removing that contribution multiplicatively leaves a hardware-driven reduction of 39% over three years, or roughly 15% per year when compounded. For the forward-looking estimate, I combine this with the averaged 29% annual serving-stack reduction derived above. Since the software contribution has already been removed from the hardware estimate, the two can be combined without double counting, giving an optimistic modeled inference-cost reduction of roughly 40% per year.
The total is close to what I would have expected before starting the analysis, but the layer contributions surprised me a bit. I would have expected the hardware-driven reduction to be higher than 15% per year, and the serving-stack reduction to be lower than 29% per year. It seems that while newly released hardware is impressive, it also carries a substantial price premium. But given the limited data and the heuristics needed to bridge the gaps, these numbers are best treated as plausible point estimates rather than precise or stable annual rates.
Much larger claims probably include model-capability improvements. While those can produce real savings for a defined use case, they are difficult to count as broad, customer-relevant reductions in inference cost.